In today’s ecommerce landscape, customer expectations are rising while logistics grow more complex. But success still starts with knowing your numbers. Whether you run your own warehouse or partner with a 3PL provider like ShipBots, having a strong grasp of supply chain formulas can drive better decisions, faster fulfillment, and healthier margins.
These 13 formulas are the backbone of performance tracking across inventory, warehousing, and distribution. Let’s break them down.
Inventory Accuracy = Physical Count / Book Count
Inventory accuracy tracks how closely your actual inventory matches what’s recorded in your warehouse management system (WMS). It may seem simple, but even a small gap can create ripple effects; delayed shipments, canceled orders, frustrated customers, and damaged brand trust. For ecommerce brands fulfilling orders on platforms like TikTok Shop or Shopify, having precise inventory records is non-negotiable. Maintaining high accuracy helps you prevent overselling, manage returns efficiently, and offer real-time availability across all channels.
Looking to take the guesswork out of inventory tracking? Our order fulfillment services provide real-time syncs with your storefronts and built-in inventory control.
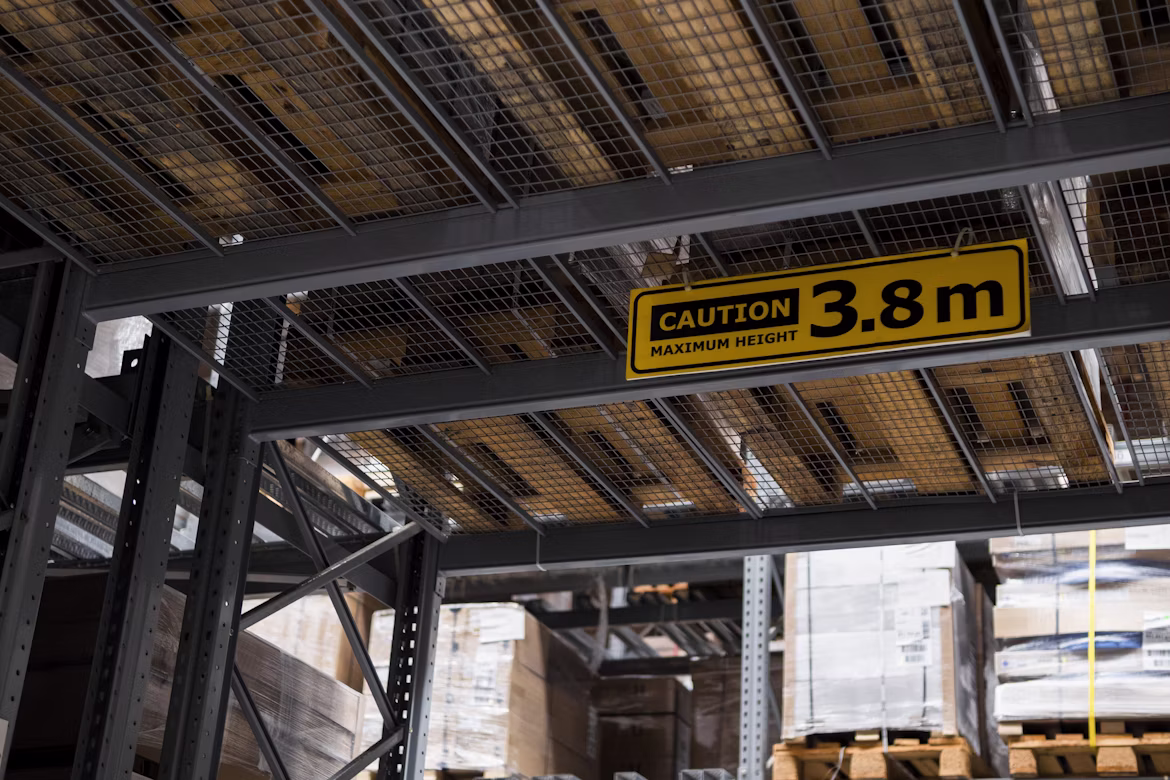
Storage Utilization = Used Storage Space / Total Warehouse Space
Think of this as your warehouse’s efficiency score. Are your shelves packed with sellable goods, or wasted space? A strong storage utilization rate means you’re using your space wisely, which translates to lower overhead and faster pick/pack times. On the flip side, poor utilization might mean you're overspending or struggling with cluttered workflows.
By partnering with local warehousing providers like ShipBots, you can scale up (or down) space without the commitment of long-term leases; keeping costs low while maintaining flexibility.
Inventory Days of Supply (IDS) = On-Hand Inventory / (Annual COGS / 365)
IDS tells you how long your current stock can support your sales without restocking. It’s crucial for ensuring smooth operations during flash sales, seasonal demand, or unexpected supplier delays. Keep this number too low, and you're at risk of selling out. Too high, and you're sitting on dead stock.
Brands with subscription box fulfillment especially need to keep a close eye on this KPI since predictable inventory turnover is vital for customer retention.
Perfect Order Percentage = On-Time × Complete × Error-Free × Correct Documentation
This all-in-one metric gives you a clear picture of your overall fulfillment performance. A “perfect order” means it was shipped on time, in full, without damage, and with the right paperwork. The higher your percentage, the fewer headaches for your support team; and the happier your customers will be.
If your perfect order rate is lagging, it may be time to re-evaluate your fulfillment workflows. Our 3PL logistics services help identify gaps and improve end-to-end order accuracy.
Total Order Cycle Time = (Order Delivered – Order Placed) / # of Orders
How long does it take for your customer to receive their order after checkout? This KPI captures the full journey from purchase to delivery. It’s a crucial metric if you’re offering fast shipping promises, especially for TikTok campaigns or flash sales where timing is everything.
ShipBots’ order fulfillment services are designed to help you keep this number as low as possible, without sacrificing reliability or cost-efficiency.
Internal Order Cycle Time = (Order Shipped – Order Released to Warehouse) / # of Orders
This measures what happens once an order hits your warehouse floor. From that point forward, how quickly can your team process and ship it? A fast internal cycle time helps maintain customer expectations, especially for businesses competing with Amazon-level speed.
Our smart warehouse workflows are optimized for speed and accuracy, helping brands streamline internal processes and cut down on lag.
On-Time Shipping Percentage = Orders Shipped on Time / Total Orders Shipped
Customers expect packages to arrive when promised… no excuses. This KPI tracks how often you meet your shipping deadlines. Falling short can lead to poor reviews and lost loyalty. It’s particularly important for brands operating in high-volume markets like Los Angeles or San Diego.
If you’re struggling with delays, ShipBots offers optimized carrier selection and same-day shipping to keep your promises intact.
Order Fill Rate = Orders Fully Shipped / Total Orders
This measures how many orders were shipped in full, without substitutions or missing items. A low fill rate can signal inventory issues, forecasting gaps, or SKU mismanagement. A consistently high rate builds trust, reduces support requests, and improves your bottom line.
With our integrated inventory solutions, we help e-commerce brands reduce stockouts and maximize fill rates automatically.
Line Item Fill Rate = Lines Shipped Complete / Total Lines Ordered
Line item fill rate drills down deeper than general order fulfillment by looking at individual SKUs. It’s especially helpful if you sell bundles, kits, or products with accessories. This metric can reveal specific issues with certain SKUs so you can fine-tune your stock levels where it matters most.
Orders Picked Per Hour = Orders Picked & Shipped / Hours Worked
This tracks how productive your warehouse team is. If your numbers are sluggish, it may point to layout issues, training gaps, or tech limitations. Improving this metric can reduce labor costs and boost throughput.
Our 3PL logistics solution includes optimized picking routes, digital scanners, and real-time performance dashboards to help your team operate at peak efficiency.
Lines Picked & Shipped Per Hour = Order Lines Picked / Total Hours Worked
This metric is particularly helpful for operations handling high SKU counts or detailed multi-item orders. It gives you a clearer picture of your team’s efficiency beyond just order volume, especially important when dealing with wholesale, B2B, or custom bundles.
Distribution Costs as % of Sales = Total Distribution Costs / Total Sales
This financial KPI shows what portion of your revenue is being eaten up by distribution. It's a powerful way to benchmark logistics performance as you scale. If this number creeps too high, it can squeeze your margins and limit marketing or product investment.
ShipBots helps reduce this ratio with efficient warehouse placement, smart routing, and access to discounted carrier rates.
Distribution Costs Per Unit Shipped = Total Distribution Costs / Units Shipped
Want to understand what it costs to get each product out the door? This metric gives you clarity on your per-unit logistics spend. It’s a must-watch for brands scaling into cost-sensitive channels like TikTok Shop or rolling out lower-priced SKUs.
It also helps shape smarter pricing and bundling strategies, critical for maximizing profit while remaining competitive.
Every ecommerce business wants to grow, but if you can’t measure your backend performance, you’re flying blind. These formulas help identify bottlenecks, benchmark productivity, and build a supply chain that scales smoothly.
Whether you’re running fulfillment in-house or looking to offload operations to a trusted partner, visibility into these KPIs is step one.
We make supply chain visibility easier and smarter. Our 3PL solutions come with built-in tools to monitor and improve your performance metrics:
ShipBots helps fast-growing ecommerce brands ditch spreadsheets and delays. From tracking KPIs to scaling fulfillment operations across subscription box, TikTok Shop, and DTC channels, we’re built to grow with you. Contact us today to streamline your e-commerce fulfillment.